fMRI Demo (SPM version)
Introduction
This is an example of RSA on a fMRI dataset that was analyzed with SPM. The data is described in the following papers:
Diedrichsen, J., Wiestler, T., & Krakauer, J. W. W. (2013). Two distinct ipsilateral cortical representations for individuated finger movements. Cerebral Cortex , 23(6), 1362–1377.
Ejaz, N., Hamada, M., & Diedrichsen, J. (2015). Hand use predicts the structure of representations in sensorimotor cortex. Nature Neuroscience, 18(7), 1034–1040.
In the paradigm, participants made individual finger presses with one of the 5 fingers of the left or right hand. The data was preprocessed and analyzed with SPM. We are providing and analyzing only one single subject’s data here https://www.dropbox.com/scl/fo/94njk5dq80niybi57cfgj/AEfF_YbXg8G50l0xgXPNzEY?rlkey=9v7x4l03xpfjrn1b6tqetw9rf&dl=0.
[1]:
%matplotlib inline
import os
import numpy as np
import pandas as pd
from rsatoolbox.data import Dataset
from rsatoolbox.io.spm import SpmGlm
import rsatoolbox as rsa
import matplotlib.pyplot as plt
Define the SPM GLM object
We need to define the directory where the example data is located.
[2]:
data_dir = os.path.expanduser('~/data/rsatoolbox/diedrichsen')
[3]:
## Initialize the GLM object from the SPM.mat file
spm=SpmGlm(data_dir + '/glm_firstlevel')
spm.get_info_from_spm_mat()
RDM from univariate pre-whitened betas
[4]:
# Get the betas and residual mean-square image for left M1
[beta,ResMS,info]=spm.get_betas(data_dir + '/anat/M1_L.nii')
print(f'Shape of Betas: {beta.shape[0]}x{beta.shape[1]}')
Shape of Betas: 80x362
[5]:
# Extract digit and hand number from regressor names
info = pd.DataFrame(info)
info['hand']=[int(r[4]) for r in info['reg_name']]
info['digit']=[int(r[11]) for r in info['reg_name']]
info['condition']=(info['hand']-1)*5+info['digit']
info
[5]:
| reg_name | run_number | hand | digit | condition | |
|---|---|---|---|---|---|
| 0 | hand1_digit1*bf(1) | 1 | 1 | 1 | 1 |
| 1 | hand1_digit2*bf(1) | 1 | 1 | 2 | 2 |
| 2 | hand1_digit3*bf(1) | 1 | 1 | 3 | 3 |
| 3 | hand1_digit4*bf(1) | 1 | 1 | 4 | 4 |
| 4 | hand1_digit5*bf(1) | 1 | 1 | 5 | 5 |
| ... | ... | ... | ... | ... | ... |
| 75 | hand2_digit1*bf(1) | 8 | 2 | 1 | 6 |
| 76 | hand2_digit2*bf(1) | 8 | 2 | 2 | 7 |
| 77 | hand2_digit3*bf(1) | 8 | 2 | 3 | 8 |
| 78 | hand2_digit4*bf(1) | 8 | 2 | 4 | 9 |
| 79 | hand2_digit5*bf(1) | 8 | 2 | 5 | 10 |
80 rows × 5 columns
[6]:
# Get a RSA dataset from the univariate prewhitened betas
data = Dataset(
            measurements=beta/np.sqrt(ResMS),
            obs_descriptors=dict(info)
)
[7]:
# Calculate the RDM on all ten conditions.

RDM_uni = rsa.rdm.calc_rdm(
    data,
    method='crossnobis',
    descriptor='condition',
    cv_descriptor='run_number')
/Users/jasper/projects/rsatoolbox/env/lib/python3.11/site-packages/numpy/core/numeric.py:407: RuntimeWarning: invalid value encountered in cast
  multiarray.copyto(res, fill_value, casting='unsafe')
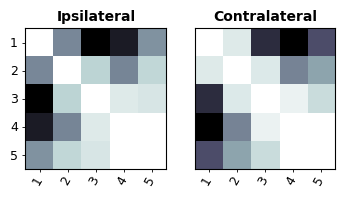
[8]:
# seperate the part for the left and right hand
left_hand_rdm = RDM_uni.subset_pattern('hand', 1)
right_hand_rdm = RDM_uni.subset_pattern('hand', 2)

# Plot the two together (note the different color scales)
RDMs=rsa.rdm.concat([left_hand_rdm,right_hand_rdm])
RDMs.rdm_descriptors['name']=['Ipsilateral','Contralateral']
rsa.vis.show_rdm(RDMs,pattern_descriptor='digit',rdm_descriptor='name')
plt.show()
RDM from multivariate pattern analysis
For multivariate pre-whitening, we need to go back to the original time series data to obtain the residuals from the first-level analysis. These are not saved by default in SPM, so we need to recompute them. While it would be possible to save the residuals in the first-level analysis, this would require a lot of disk space. Instead, we can use the original data and the design matrix to compute the residuals and betas on the fly.
[9]:
# Get the betas and residual mean-square image for left M1
[residuals,beta,info]=spm.get_residuals(data_dir + '/anat/M1_L.nii')
print(f'Shape of Betas: {beta.shape[0]}x{beta.shape[1]}')
Shape of Betas: 80x362
[10]:
# Compute precision matrix (inverse of covariance matrix) from residuals
Prec = rsa.data.noise.prec_from_residuals(
            residuals,
            dof=spm.eff_df,
            method='shrinkage_diag'
        )
plt.imshow(Prec)
[10]:
<matplotlib.image.AxesImage at 0x16c79e150>

[11]:
# Calculate the RDM on all ten conditions.
RDM_multi = rsa.rdm.calc_rdm(
    data,
    method='crossnobis',
    noise = Prec,
    descriptor='condition',
    cv_descriptor='run_number')
/Users/jasper/projects/rsatoolbox/env/lib/python3.11/site-packages/numpy/core/numeric.py:407: RuntimeWarning: invalid value encountered in cast
  multiarray.copyto(res, fill_value, casting='unsafe')
[12]:
# seperate the part for the left and right hand
left_hand_rdm = RDM_multi.subset_pattern('hand', 1)
right_hand_rdm = RDM_multi.subset_pattern('hand', 2)

# Plot the two together (note the different color scales)
RDMs=rsa.rdm.concat([left_hand_rdm,right_hand_rdm])
RDMs.rdm_descriptors['name']=['Ipsilateral','Contralateral']
rsa.vis.show_rdm(RDMs,pattern_descriptor='digit',rdm_descriptor='name')
plt.show()
