Searchlight for RSA
By Daniel Lindh (dnllndh@gmail.com)
Data used in this tutorial was used in: Cichy, R. M., Pantazis, D., & Oliva, A. (2016). Similarity-based fusion of MEG and fMRI reveals spatio-temporal dynamics in human cortex during visual object recognition. Cerebral Cortex, 26(8), 3563-3579.
In this tutorial we will load a publically available fMRI data set for one participant. In this data set subjects passively viewed 118 images (see project page, where 27 images were animate and 91 were non-animate. Using RSA we will test an “animate” model to see which voxels most correspond to animate category.
We get the searchlight centers with the corresponding neighboring voxels
Get an RDM for each voxel
Evaluate each RDM against the animate/non-animate model
Plot results
On top of using rsatoolbox, this tutorial also make use of the following:
numpy 1.18.1
matplotlib 3.1.3
nilearn 0.6.2
pandas 1.0.1
seaborn 0.10.0
nibabel 3.1.0
[ ]:
import numpy as np
import matplotlib.pyplot as plt
from nilearn.image import new_img_like
import nibabel as nib
import seaborn as sns
from nilearn import plotting
from rsatoolbox.inference import eval_fixed
from rsatoolbox.model import ModelFixed
from glob import glob
from rsatoolbox.util.searchlight import get_volume_searchlight, get_searchlight_RDMs, evaluate_models_searchlight
/Users/heiko/opt/anaconda3/envs/rsa/lib/python3.8/site-packages/nilearn/datasets/__init__.py:86: FutureWarning: Fetchers from the nilearn.datasets module will be updated in version 0.9 to return python strings instead of bytes and Pandas dataframes instead of Numpy arrays.
  warn("Fetchers from the nilearn.datasets module will be "
[2]:
def upper_tri(RDM):
    """upper_tri returns the upper triangular index of an RDM

    Args:
        RDM 2Darray: squareform RDM

    Returns:
        1D array: upper triangular vector of the RDM
    """
    # returns the upper triangle
    m = RDM.shape[0]
    r, c = np.triu_indices(m, 1)
    return RDM[r, c]
[3]:
import matplotlib.colors
def RDMcolormapObject(direction=1):
    """
    Returns a matplotlib color map object for RSA and brain plotting
    """
    if direction == 0:
        cs = ['yellow', 'red', 'gray', 'turquoise', 'blue']
    elif direction == 1:
        cs = ['blue', 'turquoise', 'gray', 'red', 'yellow']
    else:
        raise ValueError('Direction needs to be 0 or 1')
    cmap = matplotlib.colors.LinearSegmentedColormap.from_list("", cs)
    return cmap
Load data
Download Cichy’s fMRI data (subject 2) grabbed from here, unpack the file and change “data_folder” below to the appropriate folder path
This particular data set consist of one img-file per volume, so we need to loop over each file and add them to our data-array
[4]:
# set this path to wherever you saved the folder containing the img-files
data_folder = '../fmri_data/subj02'

image_paths = list(glob(f"{data_folder}/con_*.img"))
image_paths.sort()

# load one image to get the dimensions and make the mask
tmp_img = nib.load(image_paths[0])
# we infer the mask by looking at non-nan voxels
mask = ~np.isnan(tmp_img.get_fdata())
x, y, z = tmp_img.get_fdata().shape

# loop over all images
data = np.zeros((len(image_paths), x, y, z))
for x, im in enumerate(image_paths):
    data[x] = nib.load(im).get_fdata()

# only one pattern per image
image_value = np.arange(len(image_paths))
1. Get searchlight centers and neighbors
In this example we allow neighboring voxels to be 5 voxels away from the central voxel. In order for it to be a proper center at least 50% of the neighboring voxels needs to be within the brain mask (threshold=0.5)
[5]:
centers, neighbors = get_volume_searchlight(mask, radius=5, threshold=0.5)
Finding searchlights...: 100%|██████████| 61044/61044 [00:20<00:00, 3028.22it/s]
Found 56954 searchlights
2. Get an RDM for each voxel
[6]:
# reshape data so we have n_observastions x n_voxels
data_2d = data.reshape([data.shape[0], -1])
data_2d = np.nan_to_num(data_2d)
# Get RDMs
SL_RDM = get_searchlight_RDMs(data_2d, centers, neighbors, image_value, method='correlation')
Calculating RDMs...: 100%|██████████| 100/100 [10:59<00:00, 6.60s/it]
3. Load animal model and evaluate
Our animate model has a 0 wherever both pair-wise comparisons are animals and otherwise 1.
[7]:
# Load animal model
an_labels = np.load('118_images_files/118_animate_labels.npy')
an_RDM = np.load('118_images_files/118_animate_RDM.npy')
an_model = ModelFixed('Animate RDM', upper_tri(an_RDM))
[8]:
eval_results = evaluate_models_searchlight(SL_RDM, an_model, eval_fixed, method='spearman', n_jobs=3)

# get the evaulation score for each voxel
# We only have one model, but evaluations returns a list. By using float we just grab the value within that list
eval_score = [np.float(e.evaluations) for e in eval_results]
Evaluating models for each searchlight: 100%|██████████| 56954/56954 [02:40<00:00, 355.41it/s]
[9]:
# Create an 3D array, with the size of mask, and
x, y, z = mask.shape
RDM_brain = np.zeros([x*y*z])
RDM_brain[list(SL_RDM.rdm_descriptors['voxel_index'])] = eval_score
RDM_brain = RDM_brain.reshape([x, y, z])
4. Plot results
[10]:
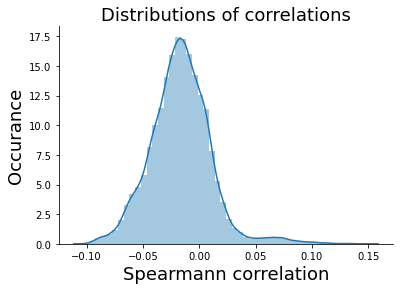
sns.distplot(eval_score)
plt.title('Distributions of correlations', size=18)
plt.ylabel('Occurance', size=18)
plt.xlabel('Spearmann correlation', size=18)
sns.despine()
plt.show()
/Users/heiko/opt/anaconda3/envs/rsa/lib/python3.8/site-packages/seaborn/distributions.py:2557: FutureWarning: `distplot` is a deprecated function and will be removed in a future version. Please adapt your code to use either `displot` (a figure-level function with similar flexibility) or `histplot` (an axes-level function for histograms).
  warnings.warn(msg, FutureWarning)
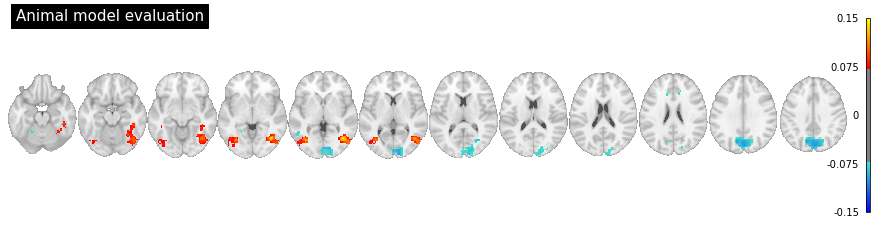
Now lets plot the brain data using nilearn. We would expect the animate model to be most pronounced along the ventral visual stream.
[ ]:
# lets plot the voxels above the 99th percentile
threshold = np.percentile(eval_score, 99)
plot_img = new_img_like(tmp_img, RDM_brain)

cmap = RDMcolormapObject()

coords = range(-20, 40, 5)
fig = plt.figure(figsize=(12, 3))

display = plotting.plot_stat_map(
        plot_img, colorbar=True, cut_coords=coords,threshold=threshold,
        display_mode='z', draw_cross=False, figure=fig,
        title='Animal model evaluation', cmap=cmap,
        black_bg=False, annotate=False)
plt.show()